Data Analytics

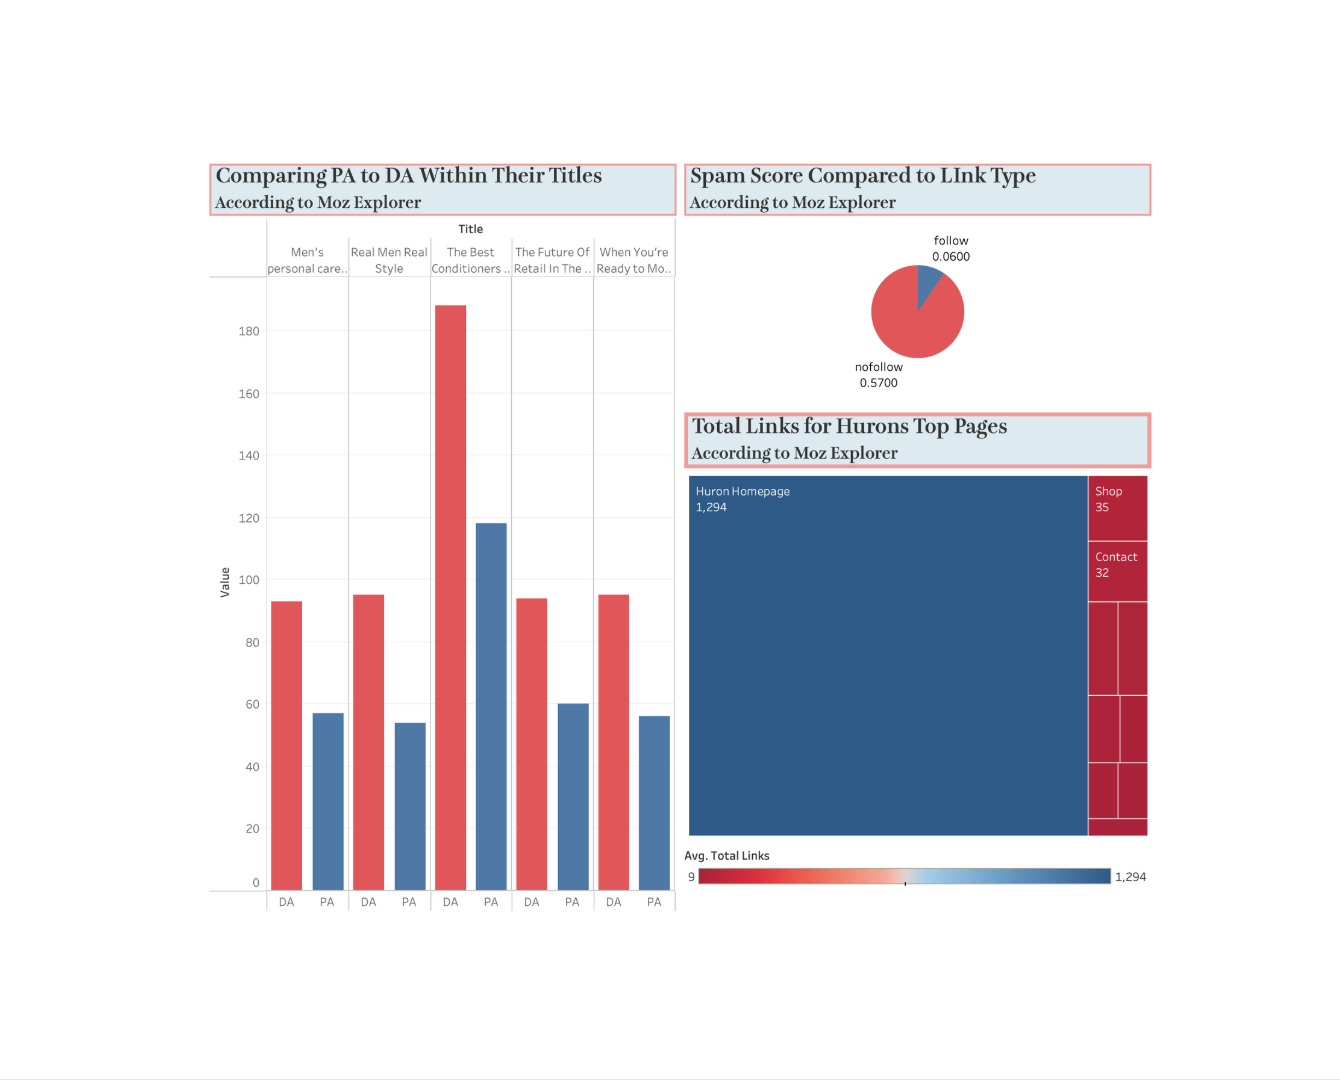
For my work with Huron, I gathered key marketing data, organized it, and created interactive visualizations to support my strategic recommendations. These visualizations provided insights into customer behavior, SEO keyword performance, and social media engagement trends. By turning raw data into clear and compelling visuals, I was able to identify growth opportunities and communicate findings in a way that was both accessible and actionable. This project highlighted the value of data-driven storytelling in shaping effective marketing strategies.

Programs Used: Tableau, Microsoft Excel, Moz, SEMrush, and Statista

These visualizations provide key insights into Huron’s SEO performance and backlink profile using data from Moz Explorer. The graphs highlight the authority and performance of top-linked pages, keyword volume trends, backlink types, and SERP competitiveness for high-traffic skincare-related keywords. Understanding which pages attract the most links, how keywords perform monthly, and which competitors rank for top keywords helps Huron identify areas to improve search visibility, strengthen domain authority, and refine content strategy. This data is critical for increasing organic traffic, boosting credibility, and staying competitive in the men’s grooming market.

Previous
Previous

Certifications

Next
Next

Content Marketing